TRADITIONAL MONITORING NOTIFIES YOU WHEN SOMETHING IS BROKEN

Every HPC shop monitors its systems….it’s basic telemetry across a select few of the thousands of parameters available from every machine in your cluster. Once a system parameter crosses a predetermined static threshold, an alert is sounded that something is broken. System administrators jump into reactive mode in an attempt to address the alert.

What tools do they have? Monitoring either provides administrators with a low-resolution glimpse of a limited number of key parameters or an overwhelming explosion of billions of data points from thousands of machines.

Either way, you’re relying on the best guess from your HPC “guru,” who’s incapable of consuming the billions of data points and relationships inherent in the telemetry. The experience and insight of the HPC guru is a critical component in the success of an HPC system, but a human cannot derive insight from billions of data points, nor can they take action in real time.


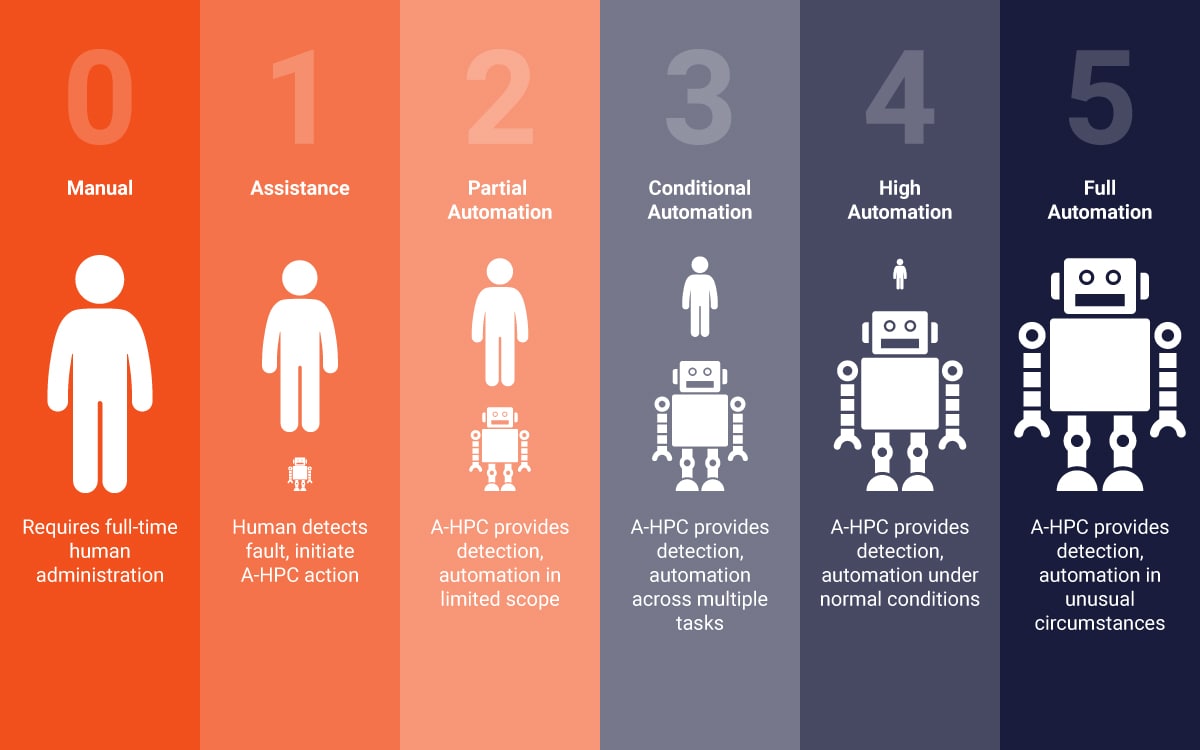
AutonomousHPC NOTIFIES YOU WHEN SOMETHING IS FIXED

AutonomousHPC combines the insight of the HPC guru with the power of the modern data warehouse, analytics and machine-learning system. A-HPC collects and warehouses 1363 unique streams of telemetry from each node that runs Spectrum Scale, Spectrum Protect, and/or Linux. A small cluster can generate billions of data points each day. AutonomousHPC doesn’t replace the insight of your guru; it provides powerful tools to automate the administrative work.

data warehouse icon

Data warehouse

ElasticSearch 6.0.0 is a scalable clustered, RESTful search and analytics engine that puts complete system telemetry at your fingertips.

monitoring

Monitoring

AutonomousHPC leverages the Grafana Bridge, developed by the IBM research team in Switzerland. AutonomousHPC is specifically designed to overcome the limitations documented by that team by adding: Deep calculation and statistical analysis, store and evaluate historical data, entire system configuration and status views.

analytics

Root Cause Analytics

Analytic processing on the high resolution in the data warehouse helps A-HPC pinpoint the conditions and relationships that contribute to events.

Machine Learning

Over time, A-HPC learns how a specific cluster operates, raising possible events based on a statistical deviation from normal operation, rather than a simple comparison against a static, predetermined value.

protective analysis icon

Predictive Analytics

Machine learning contributes to the ability to forecast the future with statistical significance. Predictive features can drive planning, forecast problems, and escalate problem patterns to human administrators.

optimization icon

Optimization and Tuning

There are over 700 Spectrum Scale settings that can affect performance. A-HPC focuses on key settings and can automatically or semi-automatically optimize, confirm, and re-optimize to meet changing workloads.

IO aware icon

Become I/O Aware

Use real-time and historical data to understand and optimize resource utilization and batch scheduling.

autonomous icon

Autonomous Action

Where possible, A-HPC is designed to offer manual or automated corrective action to system issues, delivering real-time remediation that a human administrator cannot.

reporting icon

Reporting

A-HPC adds comprehensive management and filesystem reporting.

atomic icon

Break down support silos

A-HPC isn’t focused on one technology, or one vendor.

Feature 1

RearView Mirror

RearView Mirror leverages a powerful RESTful search and analytics engine to collect and interpret billions of data points each day. The analytics engine applies machine learning and dynamic thresholding to interpret this data into a statistically meaningful composite understanding of a clustered system. Use the RearView Mirror to understand the history of the machine, perform detailed fault analysis, and system planning.

Feature 2

Dashboard

The Dashboard features of AutonomousHPC provides a powerful alternative to traditional monitoring tools. With potentially billions of daily data points, the dashboard focuses on high-level virtual sensors that consolidate the data into meaningful usage and efficiency metrics, with immediate escalation of statistically significant exceptions to the norm. Dashboard allows drill-down exploration into the lower-level summary and raw data.

Feature 3

Navigator

The Navigator function offers utility similar to the GPS nav in your car. Navigator extends the historical information to understand and predict optimal system operation. Like the system in your car, the Navigator is designed to detect variation from the optimal course and offer possible course corrections. Navigator can be a powerful tool to identify system bottlenecks and plan for future investment in the machine.

LEVELS OF AUTOMATION

The automobile industry realizes the terrific potential of a continuum of automated features that range from convenience to safety and from efficiency to performance and reliability. In response to the increasing levels of automation in today’s automobile, the automobile industry has adopted an SAE standard as a taxonomy to describe the relationship between the driver and the automation features of the car.

Re-Store’s automation model mirrors the SAE standard, with the achievable goal of understanding, detecting, and automating the most common issues. Any atypical issues will immediate escalate via SupportLink to Re-Store’s help desk for resolution and inclusion in future releases of AutonomousHPC.

restore infograph

AutonomousHPC EDITIONS

AutonomousHPC is offered in two editions. Both editions are agentless and collect up to eleven channels (with 1300+ individual streams) of cluster telemetry, transformed into a ready-to-use analytics platform. Perform complex analysis of your cluster infrastructure with time series, moving averages, correlation, detect statistically significant changes from learned behavior, and use empirical information to make big budget decisions on your machine.

Standard Edition

Completely passive, providing a full-featured analytics and alerting platform. Imagine that you’ve bought an autonomous car and set it in manual mode.

Enterprise Edition

Includes all of the multi-channel collection of telemetry, the analytics engine, and adds the features to gently ease into additional levels of automation, optimization, and intervention.

Standard Edition Enterprise Edition
Telemetry Collectors
ACPI
IPMI
SNMP
syslog
linux metrics
mmhealth
mmperfmon
perfmon
mmdiag
Spectrum Protect Optional Optional
Spectrum Compute (LSF) Optional Optional
Data Warehouse 3 Months Unlimited
Cluster Analytics Nodes 3 Max Unlimited
Data Visualization
Monitoring & Alerting
Re-Store Helpdesk Integration
Appliance-based nodes
Auto Performance Optimization
Auto Fault Correction
Problem Determination Guide
Root Cause Analysis
Event Handlers